Magnetometry
Obviously, magnetic measurements (magnetization and magnetic susceptibility) are key to the study of quantum magnetism. The technical difficulty is to measure these quantities in small samples, at very low temperatures and in high magnetic fields. We use several methods.
For measurements down to 1.8 K and up to 14 T we use a vibrating sample magnetometer (VSM) or an AC-susceptometer that are commercial inserts for our three Quantum Design PPMS systems.
Temperature dependence of magnetization measured in Pb2VO(PO4)2 using a commercial VSM helps reconstruct the phase diagram of this frustrated ferro-antiferromagnet. For more details see external page F. Landolt, S. Bettler, Z. Yan, S. Gvasaliya, A. Zheludev, S. Mishra, I. Sheikin, S. Krämer, M. Horvatić, A. Gazizulina, and O. Prokhnenko, arXiv:2006.04592 (2020).
Very precise magnetization measurements can be done in fields up to 7 T with a SQUID magnetometer, which also is a commercial Quantum Design MPMS system. With a 3He insert we can reach temperatures down to 500 mK. The MPMS can also be used with a customized 6 kbar pressure cell.

Scaling of critical magnetization near the saturation field in the spin-nematic candidate material BaCdVO(PO4)2 (a) Raw data, taken in the interval 0.5–4 K with our MPMS SQUID magnetometer. (b) Scaling plot revealing a spectacular data collapse. For more details see external page K. Yu. Povarov, V. K. Bhartiya, Z. Yan, and A. Zheludev, Phys. Rev. B 99, 024413 (2019).
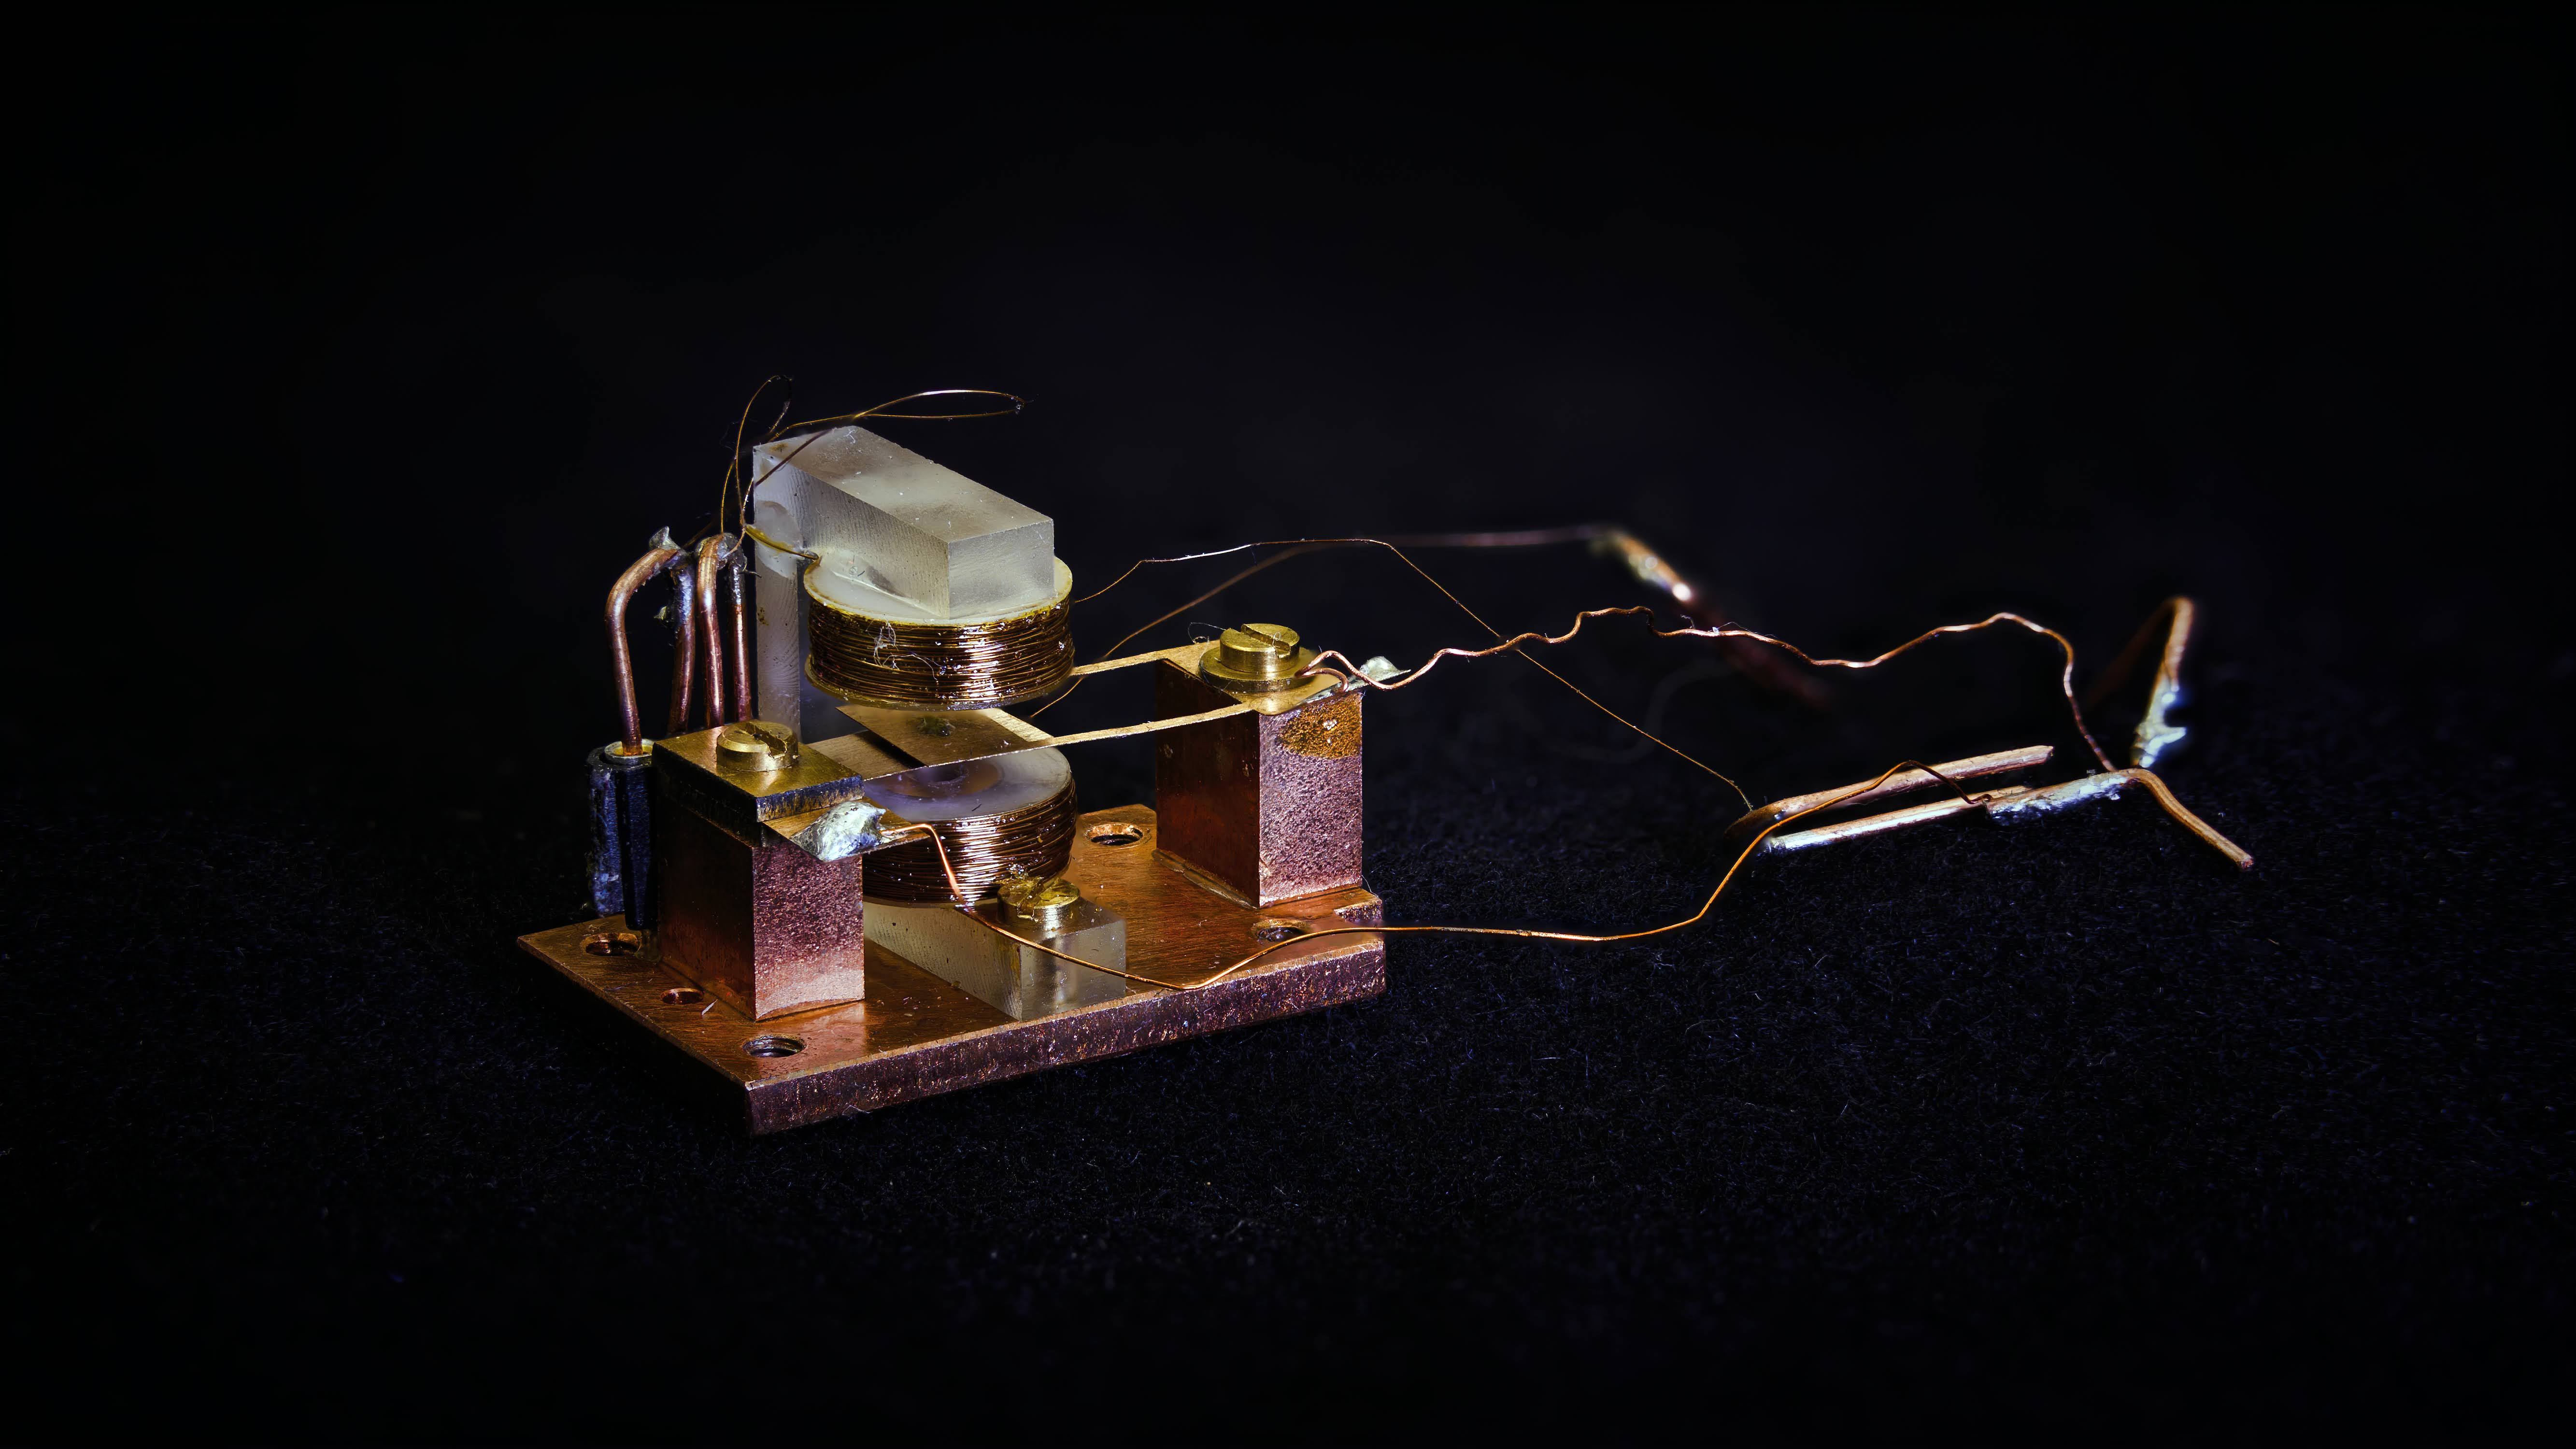
There is no reliable commercial equipment to explore lower temperatures, so we have designed our own. In particular, we have built a differential Faraday force magnetometer (see photo at top of page) that can be used at temperatures as low at 50 mK in fields up to 14 T. This device is described in external page D. Blosser, L. Facheris and A. Zheludev, Review of Scientific Instruments 91, 073905 (2020).

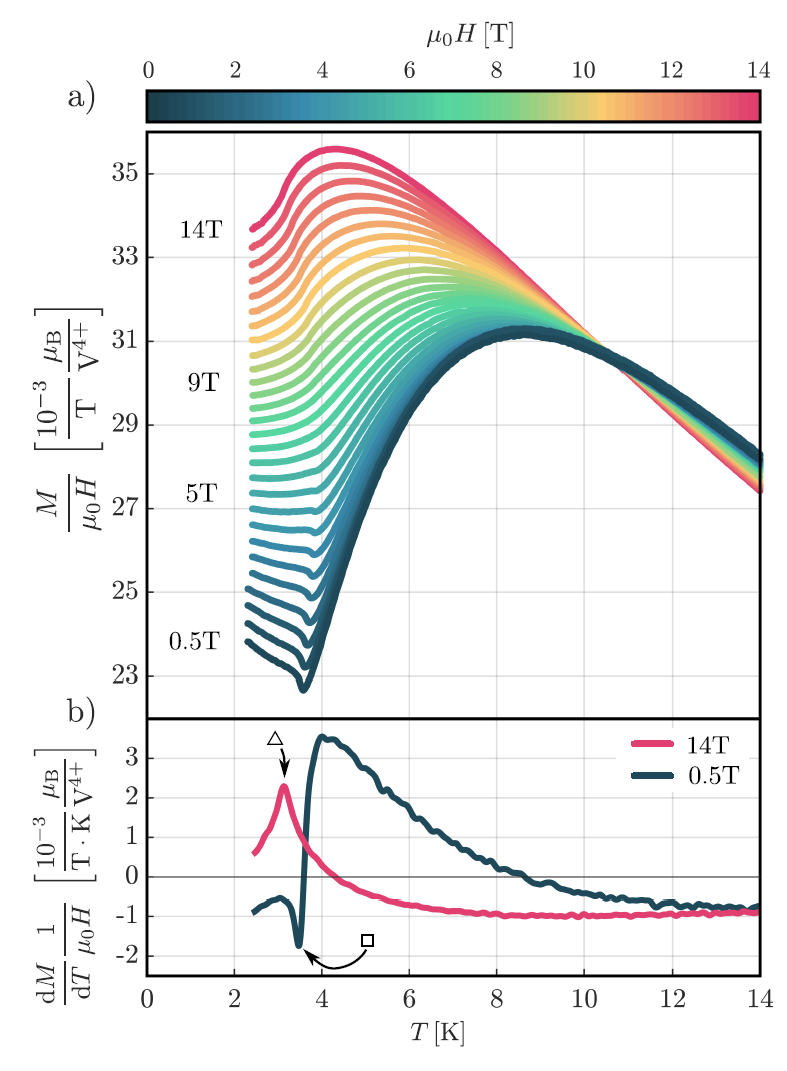
Magnetization curves of a frustrated 2D antiferromagnet Cs2CoBr4 measured with our Faraday balance magnetometer at 100 mK. See K. Yu. Povarov, L. Facheris, S. Velja, D. Blosser, Z. Yan, S. Gvasaliya, A. Zheludev., external page arXiv:2004.09893 for further details.
Another tool that we have developed is a magnetic torque meter: it measures the torque the sample experiences in an external magnetic field. The results are difficult to interet quantitatively, but any "feature" in the torque curves ususally indicate a phase transition. This technique is extremely sensitive and allows to explore the complex phase diagarms of quantum magnets.

Magnetic torque measurements reveal a cascade of quantum phase transitions in the frustrated ferro-antiferromagnet Cs2Cu2Mo3O12. A detailed report can be found in external page D. Flavián, S. Hayashida, L. Huberich, D. Blosser, K. Yu. Povarov, Z. Yan, S. Gvasaliya, and A. Zheludev, Phys. Rev. B 101, 224408 (2020).

As a rule, magnetic properties of quantum magnets are anisotropic. Their magnetic phase diagrams are, as a result, highly field dependent. Re-mounting the sample in multiple orientations for measurements is very impractical because of the time needed to cool down the sample in the cryostat, measure, warm it up and re-mount. Instead, we have developed a piezoelectric step-motor to rotate the sample mounted on a magnetic torque-meter. The device works at dilution-cryostat temperatures.

In this example we employ this device to map out the three-dimensional magnetic phase diagram of the frustrated ferro-antiferromagnetic spin chain compound PbCuSO4(OH)2. For more details see external page Y. Feng, K. Yu. Povarov, and A. Zheludev, Phys. Rev. B 98, 054419 (2018).
Sometimes the magnetic fields we need are too strong to produce in our lab. In these cases we take our samples to one of the high-field user facilities, such as those of the external page European Magnetic Field Laboratory. We regularly perform experiments using resistive, superconducting and pulsed magnets in Dresden, Toulouse and Grenoble.

Evolution of the magnetic Bose-Einstein condensate in (C4H12N2)Cu2(Cl1−xBrx )6 with Br-concentration in fields up to 45 Tesla. The false color plot is of magnetic susceptibility. The data were taken at the pulsed-field facility in Toulouse, France. More details in external page D. Hüvonen, G. Ballon, and A. Zheludev,Phys. Rev. B 88, 094402 (2013).